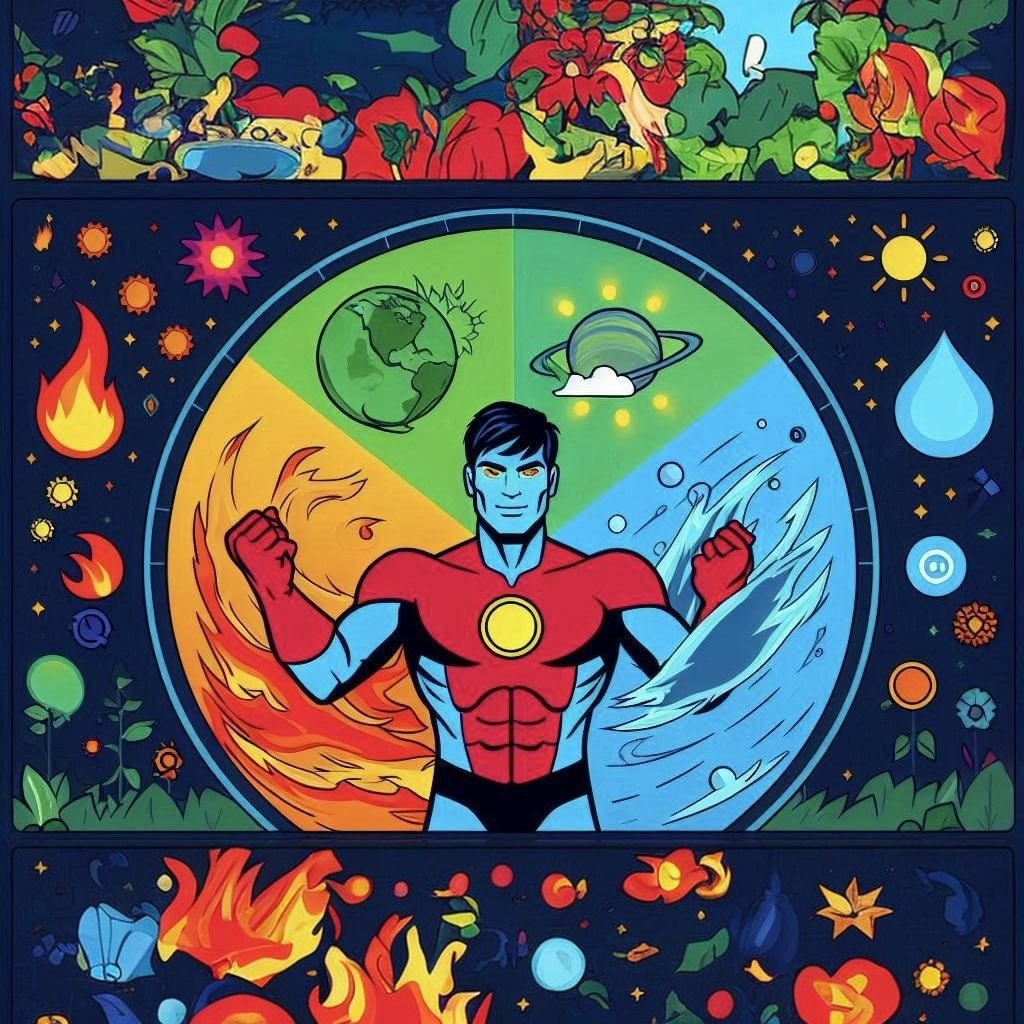
EnerGenius

EnerGenius is the next step in our journey to understand and visualise energy use and its environmental impact. While our Dashboard shows how the UK harnesses elemental energies, and the Carbon Intensity map displays real-time emissions across Great Britain, EnerGenius takes a more personalised approach.
Currently, EnerGenius focuses on weather visualisation. Simply enter a location, and it will generate a visual representation of the current weather conditions at that location. This feature helps you see how elemental forces like wind, sun, and water are at play in specific areas.
Would you like to see more?
In the future, EnerGenius will evolve to combine this weather data with energy information. It will help you understand how weather patterns influence energy use and carbon intensity in your chosen location, by looking at historical data and predicting future patterns. By providing visuals, EnerGenius aims to make complex energy and environmental data accessible and actionable, empowering you to make informed decisions about energy use and its impact on our world.